
The GE-McKinsey (9-box) Matrix (aka Directional Policy Matrix) is a tool that enables a firm to understand which are its strong products/segments, where it has a strong competitive position so that it can focus better on those areas.
This tool enables a firm to carry out analysis of its portfolio of products or various areas of operation.
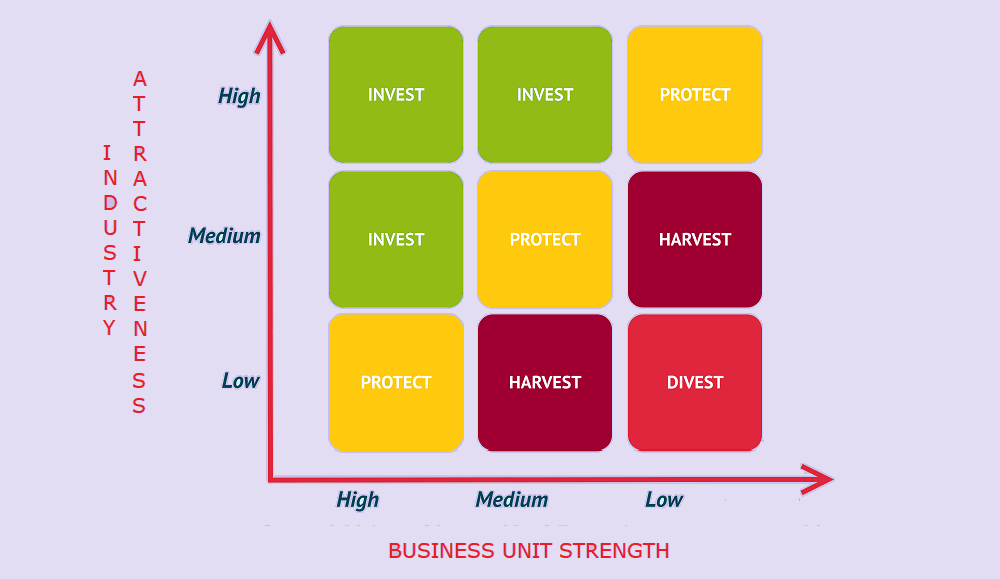
It is a framework for classifying an organisation’s business activities in terms of its strengths, capabilities or market position, and the way it perceives markets to be attractive.
In the matrix, attractiveness of the market is plotted against business strength of the firm, which enables the firm to better understand which areas need to be prioritized for resources.
How to read the Directional Policy matrix.
First you need to get data for any product of the company (for the latest year).
A firm should Invest in a product/segment if it shows High market attractiveness and high business strengths.
It the market is growing, if the company’s product has higher market share, strong innovation + R&D, strong capital + cash flows, economies of scale and higher profit margins, the company should invest more (add more resources to that product/segment) as the market attractiveness is high and the business strengths are also high.
A firm should ‘Grow’ if it shows High Market Attractiveness and Low Business Strengths.
If the data shows high market growth but low market share, lower spends on Innovation + R&D, weak capital + cash flows, low Economies of scale, poor Profit margins, the firm should decide to Grow in that segment.
Harvest if High business Strengths and Low Market Attractiveness.
If the market growth is low but the firm has strong R&D, strong human capital, strong cash flow, and there is high cost to market entry, then the company may decide to Harvest the profits for as long as possible.
Divest is Low Market Attractiveness and Low Business Strengths.
On the other hand, if the product segment shows low market attractiveness and low business strengths, it should consider Divesting.
Directional Policy Matrix (DPM): Example
Invest (High Market Attractiveness, High Business Strengths):
Explain any product of the company (data from a particular year)
- a)Market share
- b)Innovation + R&D
- c)Strong capital + cash flows
- d)Economies of scale
- e) Profit margins
Grow (High Market Attractiveness, Low Business Strengths):
Explain any product of the company (data from a particular year)
- a) Market share
- b) Innovation + R&D
- c) Weak capital + cash flows
- d) low Economies of scale
- e) Poor Profit margins
Harvest (High business Strengths, Low Market Attractiveness):
Explain any product of the company (data from a particular year)
- a) Strong R&D
- b) Strong human Capital
- c) Strong Cash flow
- d) Low market growth
- e) High cost to market entry
Divest (Low Market Attractiveness, Low Business Strengths):
Explain any product of the company (data from a particular year)


BATheories.com is managed by a group of educators from Mumbai. We also manage the website AcademicsHQ.com. Our panel includes experienced professionals and lecturers with a background in management. BATheories is where we talk about the various business theories and models for BA (Business Administration) students.