Understand more about financial ratios and what they inform about the business. Learn to calculate and analyse some key financial ratios and draw overall conclusions about a business based on these ratios.
“A set of accounts is like a book, which contains the story of a business…but like any good book there is a hidden meaning”. (Dyson 2020)
One of the most important way of interpreting accounts is ratio analysis. This compares accounting data with each other to get a better picture of what this hidden story is.
For example if a company makes $50m profit, is this good/bad or just okay? You can only answer this question if you compare it to other accounting numbers. For example the amount of sales needed to generate this profit or the amount of money invested in the business. This is called a ratio.
Financial ratios are useful indicators of a firm’s performance and financial situation. These can help to make sense of the overwhelming amount of numbers and information that is commonly found in any company’s financial statements.
Most ratios can be calculated from information provided by a company’s consolidated financial statements. The three most important financial statements are the income statement, balance sheet and cash flow statement.
Context for Ratio Analysis
A transaction occurs and is recorded in the accounting books through double entry.
This is published in financial accounts which is available to the public. These accounts are then interpreted using ratio analysis.
Financial Ratios are commonly used to analyze trends and to compare the firm’s financials to those of other firms. In some cases, ratio analysis can predict future bankruptcy.
Ratios Benchmarks
Ratios may be compared with:
- Past periods
- Similar businesses for the same period
- Planned performance
While there are quite a few financial ratios, investors usually use a handful of them over and over again.
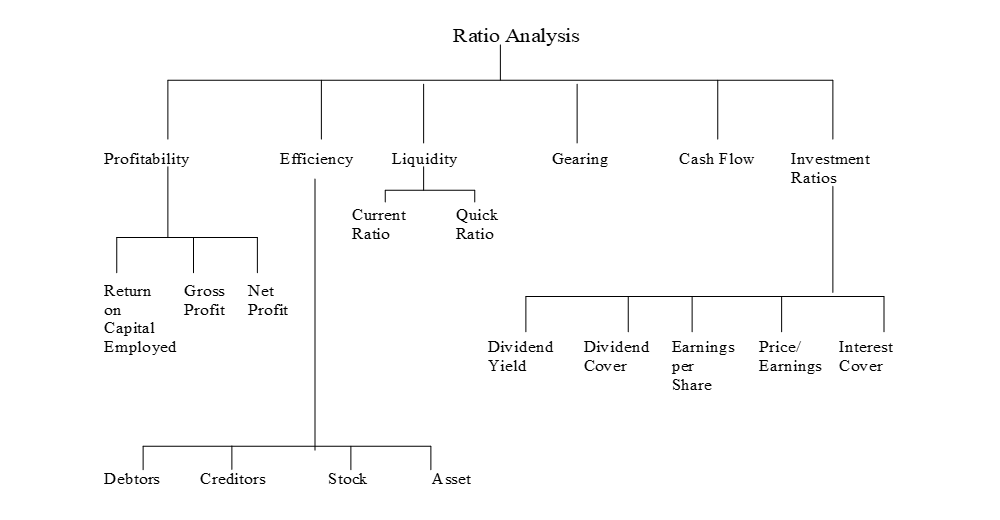
Here are the more commonly used Financial ratios:
- Liquidity ratios
- Asset turnover ratios
- Financial leverage ratios
- Profitability ratios
- Dividend policy ratios

Let’s take a closer look at some of the commonly used ratios; how they are calculated and what it tells you about the business.
Profitability Ratios
Operating Profit Margin (OPM)
(Operating / Profit) / (Sales Revenue) * 100
Net Profit Margin
Net Profit Margin = Net Income / Net Sales
Profit margin calculates how much of a company’s total sales flow through to the bottom line (is getting converted into net profit). Because higher profits are better for shareholders, a high (and/or increasing) profit margin is preferred by investors.
You also have Gross Profit Margin and Operating Profit Margin.
Gross Profit Margin shows the percentage of revenue after subtracting the cost of goods sold involved in production, Operating profit margin on the other hand also includes operating expenses like overhead.
Net profit is the gross profit minus operating expenses and all other expenses such as taxes and interest on debt.
Return on ordinary shareholder’s funds (ROSF)
(Profit for the year less any reference dividend) / (Ordinary share capital + Reserves) * 100
Efficiency Ratios
Return on Capital Employed (ROCE)
Return on Capital Employed (ROCE) = EBIT / Capital Employed where
Capital Employed = Total Assets – Current Liabilities
This ratio measures a company’s profitability and the efficiency with which capital is used. It reveals how well a company is generating profits from the capital employed.
Average inventories turnover period = (Average inventories held) / (Cost of Sales) x 365
Average settlement period for trade receivables = (Average trade receivables) / (Credit sales revenue) x 365
Average settlement period for trade payables = (Average trade payables) / (Credit purchases) x 365
Sales revenue to capital employed = (Sales revenue) / (Share Capital + Reserves + Non-current liabilities)
Sales revenue per employee = (Sales revenue) / (Number of employees)
Liquidity Ratios
Current Ratio
Current Ratio = Current assets / Current liabilities
The current ratio measures a company’s ability to pay its short-term liabilities with its short-term assets. If the ratio is over 1.0, the firm has more short-term assets than short-term debts. But if the current ratio is less than 1.0, the opposite is true and the company could be vulnerable to unexpected impacts due to the economy or business climate.
Quick Ratio
Quick Ratio = (Current assets – Inventories) / Current liabilities
The quick ratio (also known as the acid-test ratio) is similar to the quick ratio but takes the concept one step further. The quick ratio removes out inventory from the equation because it assumes that selling inventory would take several weeks or months. The quick ratio only takes into account those assets that could be used to pay short-term debts today.
Inventory Turnover Ratio
Inventory Turnover Ratio = Sales / Average Inventory where Average inventory = (Beginning Inventory – Ending Inventory) / 2.
Some analysts use cost of good sales (COGS) instead of sales for better accuracy because sales include markup over cost. Average Inventory is used to help remove seasonality effects.
Low turnover implies weak sales and possible excess inventory, while a high ratio indicates either strong sales or insufficient inventory.
Gearing Ratios
Debt-to-Equity Ratio
Debt-to-Equity Ratio = Total Liabilities / Total Shareholder Equity
This ratio measures the relationship between the amount of capital that has been borrowed (i.e. debt) and the amount of capital contributed by shareholders (i.e. equity). Generally speaking, as a firm’s debt-to-equity ratio increases, it becomes more risky because if it becomes unable to meet its debt obligations, it will be forced into bankruptcy.
Interest Cover Ratio = (Operating Profit) / (Interest Payable)
Investment (Valuation) Efficiency Ratios
Price-Earnings (P/E) Ratio
P/E is calculated as Share price / EPS, where Earnings per Share (EPS) = Net income / total outstanding shares
General rule of thumb is that shares trading at a “low” P/E are a value buy, though the definition of “low” varies from industry to industry.
More Financial Ratios
Dividend Payout Ratio
Dividend Payout Ratio = Dividend / Net Income
Dividends are the main way companies return money to their shareholders. Some people prefer to invest in companies with a steady dividend, even if the dividend yield is low, while others prefer to invest in stocks with a high dividend yield. Each company sets its own dividend policy according to what it thinks is in the best interest of its shareholders.
Limitations of Ratio Analysis
There are some limitations of financial ratio analysis as well:
Limited Scope: Ratios only provide limited information about a company’s financial performance and can overlook important qualitative factors.
Financial ratios are dependent on the quality of financial statements. Ratios can be manipulated by adjusting accounting methods or by selectively reporting financial information.
Comparing ratios across companies can be difficult due to differences in accounting methods and industry standards.
Changes in inflation rates can distort financial ratios and make year-to-year comparisons difficult.
BATheories.com is managed by a group of educators from Mumbai. We also manage the website StudyMumbai.com. Our panel includes experienced professionals and lecturers with a background in management. BATheories is where we talk about the various business theories and models for BA (Business Administration) students.

Leave a Reply